By Tyrone Burke
The Carleton Immersive Media Studio (CIMS) has digitized King Tut’s tomb and Morocco’s kasbahs, but that’s nothing compared to what they’ve got on tap.
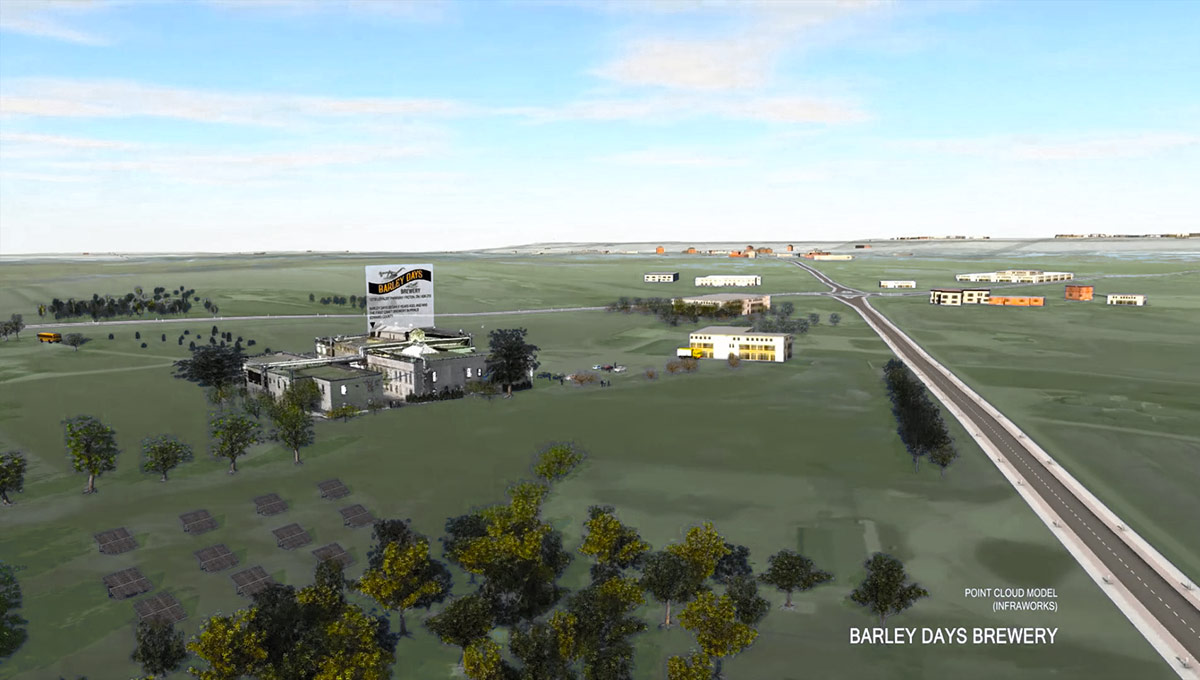
Using a combination of terrestrial laser scanning, building information modelling (BIM) and open-source data, CIMS is creating a hyper-realistic 3D model of eastern Ontario that will put the region’s entire economic activity at the fingertips of the Ontario East Economic Development Commission, its partner on the 3D mapping project.
And like so many stories do, this one begins with beer.
“These are all the breweries in eastern Ontario,” says lead researcher Stephen Fai, associate professor of Architecture and Urbanism and director of CIMS.
Fai is pointing toward an ultra HD screen pinned with dozens of flags. At first glance, you might think he’s about to show you little more than a sharper, more vivid version of Google Earth.
You’d be wrong.
“You can look at the data at a high level, or you can start to drill down,” Fai says, zooming in on the Lake Ontario shoreline.
“These are the four breweries in Prince Edward County. And these are all the hops producers and grain producers in that area.”
Strikingly Accurate Reproductions
The tool uses its own browser, and allows users to explore each brewery’s buildings, inside and out. Fai’s team used BIM – which makes measurements by using laser scans to record and reproduce the exact positions of surface points — to create strikingly accurate interactive reproductions of freshly shined brewing kettles and fermentation tanks.
“You can get so close you can almost taste it,” says Andrew Harkness, a researcher on the project. “You can even get to the point where – if the company gives you a product code for whatever you’re ordering – you can click on it, search your product code and see where it is in the manufacturing process. You can see it is in this stage of development and is “X” many days away from being completed.”
The Ontario East 3D mapping project not only integrates data that the CIMS teams records, but also farm business registration data from the Ontario Ministry of Agriculture, Food and Rural Affairs. Using codes from the North American Industry Classification System (NAICS), they can identify which farmers are growing what and where they’re growing it.
It enables Ontario East Economic Development to connect businesses in a sprawling region that stretches from Port Hope — just east of Toronto — to Ontario’s border with Quebec. At 46,200 square kilometres, Ontario East is nearly the size of Nova Scotia.
Economic Implications for Ontario East
For economic developers, the implications are huge.
“Say you’re a brewery,” says Cindy Phillips McCann, economic development officer with the Town of Petawawa, “and you’re looking for alternative sources for hops. In certain areas in Ontario East, hops are hard to come by, and brewers have to bring them in from far away. So you have the data up there from the hop producers – this is the number of hectares we cultivate, this is what we’ve currently got, this is what is already spoken for, this is our excess capacity. It makes my response time so much faster as opposed to: ‘Let me gather the data and put a prospectus together for you.’ This makes a world of difference. Once you have all that information in there, it makes it so much easier.”
With the 3D mapping project, Ontario East Economic Development is thinking big. Fai’s team has already moved beyond beer to incorporate all of the region’s agriculture and food production, as well as the infrastructure that supports it.
“As soon as he gets that done, we’ll be moving to the manufacturing industry,” says Executive Director Bonnie O’Neill. Tourism and transportation infrastructure will come later, and as O’Neill sees it, the project is still in its infancy.
“Every flag on the map represents a primary producer and a NAICS code, but it’s still very basic,” she says. “I click on a flag, it tells me the code. I look it up, and that tells me what is produced there.
“We’ve been working with municipalities to fill in the supply chain – processors, agri-businesses, agricultural colleges. We’re also working with a company out of Toronto to do a sweep of open data. Find out as much of what’s out there through Google, web searches, or anything else. They grab open data, and then we have that in. Data is moving at such a rate that a lot of this stuff is going to be open as governments move in that direction. We’re just trying to put it all in one spot.”
Tuesday, May 15, 2018 in Innovation, Research
Share: Twitter, Facebook