By Joseph Mathieu
An estimated 1.5 million Canadians identify as having vision loss, according to the CNIB Foundation. Those affected still need to be able to use products such as documents, forms, books and messages in the course of their everyday lives.

Prof. Majid Komeili
Sectors including banking, healthcare and all levels of government therefore need their products be accessible to clients with visual impairment.
The demand is also acute in education, where textbook publishers, students, teachers and institutions regularly require accessible reading material—and often very quickly.
“Imagine there is a final exam and we only have a few days to convert the exam sheet to a tactile format,” says Majid Komeili, assistant professor in Carleton’s School of Computer Science.
“It can sometimes take weeks to transform visual graphics into tactile ones, and this is a challenge when it’s so time sensitive. It can also be very expensive.”
Conveying Information in Pictures
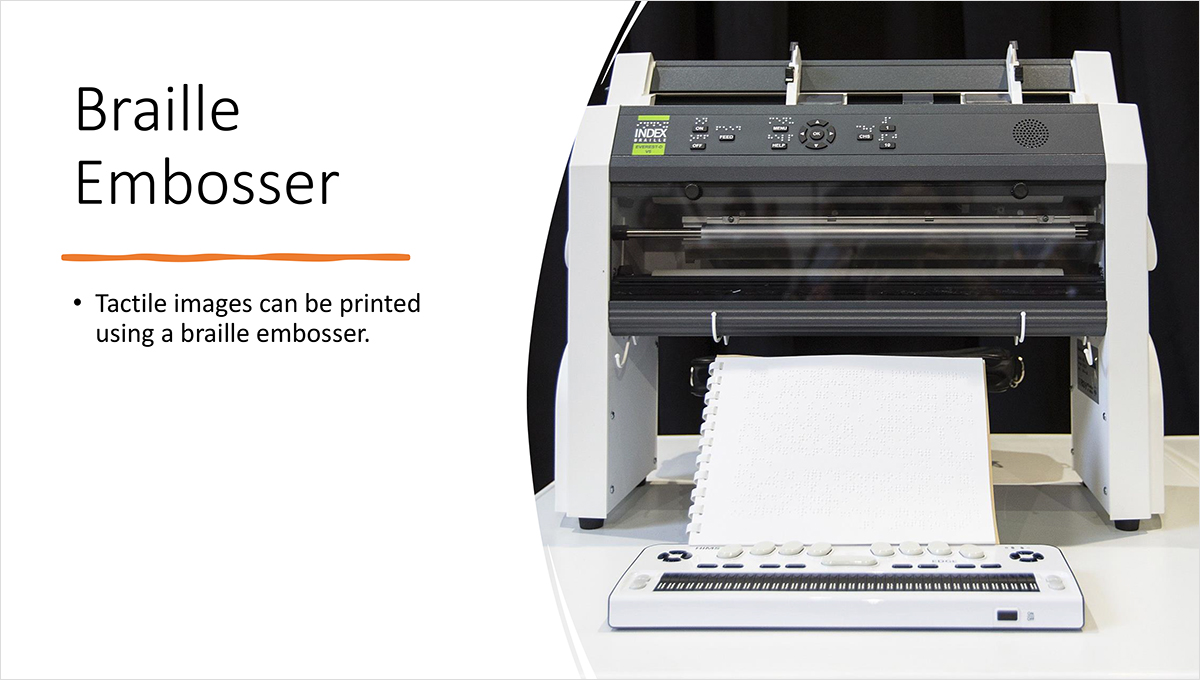
Textured or raised surfaces that convey the information in pictures, diagrams or graphs are the most effective way of communicating visual information to the blind or partially blind. The content of a tactile graphic can help users understand information through touch and, like braille, they can be created with an embosser.
But designing a tactile bar chart or scatter plot to match its visual counterpart is more complicated than it seems. A tactile Cartesian graph is meant to be a meaningful representation of a visual one—not a perfect reproduction of it.
This conversion work is left to tactile graphic designers who must determine what to keep and what to leave out. A good tactile design must be simple, clear and uncluttered. Completing this work quickly can be challenging.
Which is where Komeili and his expertise in machine learning (ML) and explainable artificial intelligence (XAI) come into play. Last year, Komeili was awarded an NSERC Alliance grant to work in collaboration with T-Base Communications to automate the conversion of graphics to an accessible format for blind people.
Improving Tactile Graphic Design
Komeili, who joined Carleton’s School of Computer Science in 2018, is working on an AI-based model that quickly determines the core components of a visual graph. The model will receive an image and automatically spit out a tactile version that can be edited or tweaked by tactile graphic designers.
![]() His industry partner is Ottawa’s T-Base Communications, which specializes in providing in accessible communications products, such as statements, documents and textbooks, for large organizations. T-Base’s ability to develop products in both print and online formats have cemented their reputation within the North American accessible communications market.
His industry partner is Ottawa’s T-Base Communications, which specializes in providing in accessible communications products, such as statements, documents and textbooks, for large organizations. T-Base’s ability to develop products in both print and online formats have cemented their reputation within the North American accessible communications market.
Komeili’s AI-based tool will help tactile graphic designers save time on the analysis and simplification of visual graphics. This would allow for homework, exams and other educational materials to become quickly available to students with visual impairment.
“Once complete, the AI will be able to understand this image—it won’t just be blindly mapping it pixel by pixel,” says Komeili.
“We are hoping that we can automate this process with a minimal intervention from the tactile designer.”
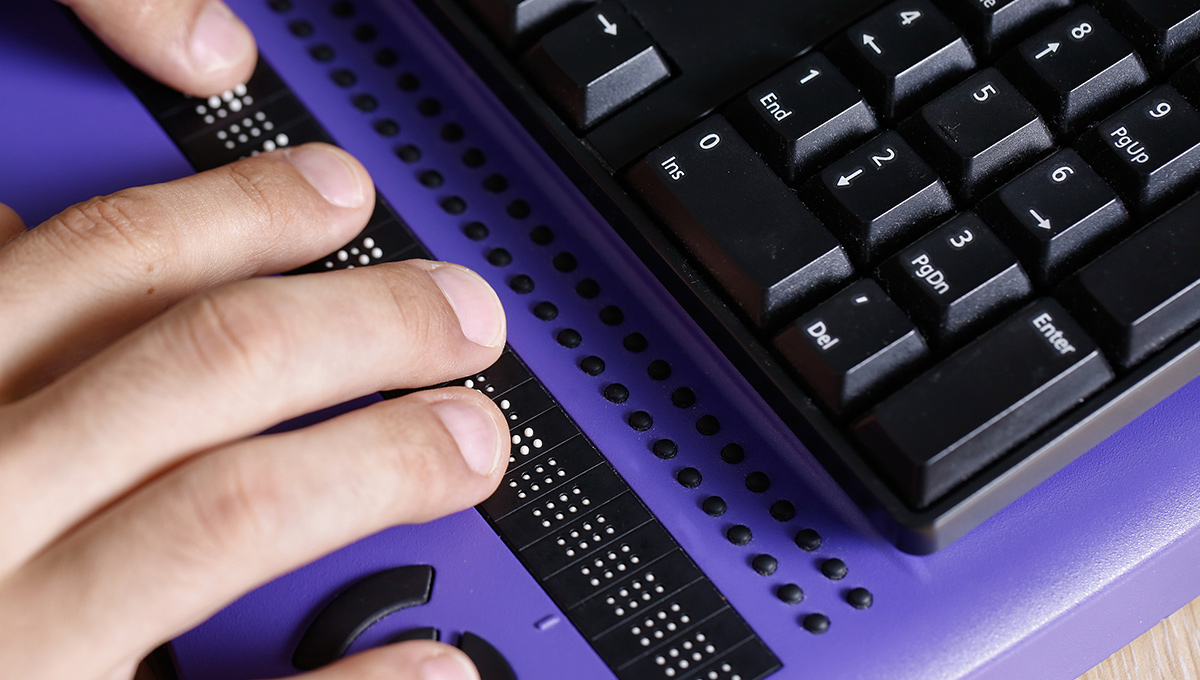
The AI will follow the Braille Authority of North America’s Guidelines and Standards for Tactile Graphics (2010), which assures a global standardization of braille and tactile graphics. Lines must have a minimum thickness and dots will stand out with gaps around them, all of which helps people with visual impairments better see things with their fingertips.

Progress and Potential
There is hope that the applications for this conversion tool will be as limitless as the realms of human knowledge. Cellular biology, thermodynamics, electronic circuitry, and all manner of infographics and iconography could be quickly identified and converted. For now, the project is focused on 2D graphs so the model can learn to quickly determine what core information of graphics must be kept.
Mohammad Heydari and Hilaire Djani
This requires a massive amount of training data for the AI to review. Master of Computer Science Student Mohammad Heydari and Bachelor of Engineering student Hilaire Djani are supporting Komeili in either generating or finding thousands of images for their model. So far, their dataset has used upward of 50,000 images of 2D charts.
“We are working the model to learn new tasks, and to learn with less,” says Komeili.
“Right now, it’s able to translate different types of graphs individually. Once we can do five different-looking charts, then the next step is to come up a better system, a better approach, that is built on generalization.”
Now that the team is halfway through their journey, Komeili says they have a good understanding of what can be achieved. “We have this road map and we are just working toward a tool that can do some good.”
Wednesday, April 27, 2022 in Computer Science, Health, Innovation
Share: Twitter, Facebook